
import numpy as np
import matplotlib.pyplot as plt
data1,data2,data3,data4,data5 = [np.random.normal(np.random.randint(3,15), np.random.randint(1,10), np.random.randint(1000,1500)) for i in range(5)]
fig = plt.figure(figsize=[8,6])
# ボックスプロットを作成
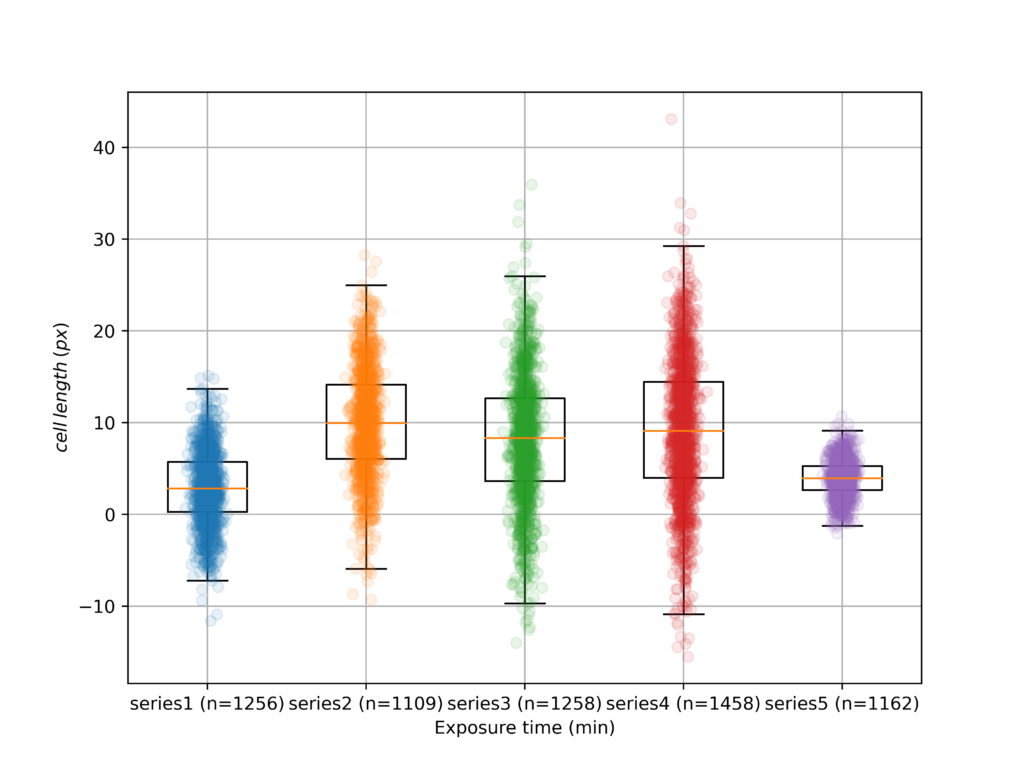
plt.boxplot([data1,data2,data3,data4,data5],sym="")
# データポイントをプロット(外れ値を含む)
for i, data in enumerate([data1,data2,data3,data4,data5], start=1):
x = np.random.normal(i, 0.04, size=len(data)) # データポイントのX座標を少しずらす
plt.plot(x, data, 'o', alpha=0.1)
# 各プロットにラベルを追加する
plt.xticks([1, 2, 3, 4,5], [f'series1 (n={len(data1)})', f'series2 (n={len(data2)})', f'series3 (n={len(data3)})', f'series4 (n={len(data4)})', f'series5 (n={len(data5)})'])
# グラフを表示
plt.xlabel('Exposure time (min)')
plt.ylabel(r'$cell\:length\: (px)$')
plt.grid(True)
fig.savefig("result.png",dpi = 500)実行結果