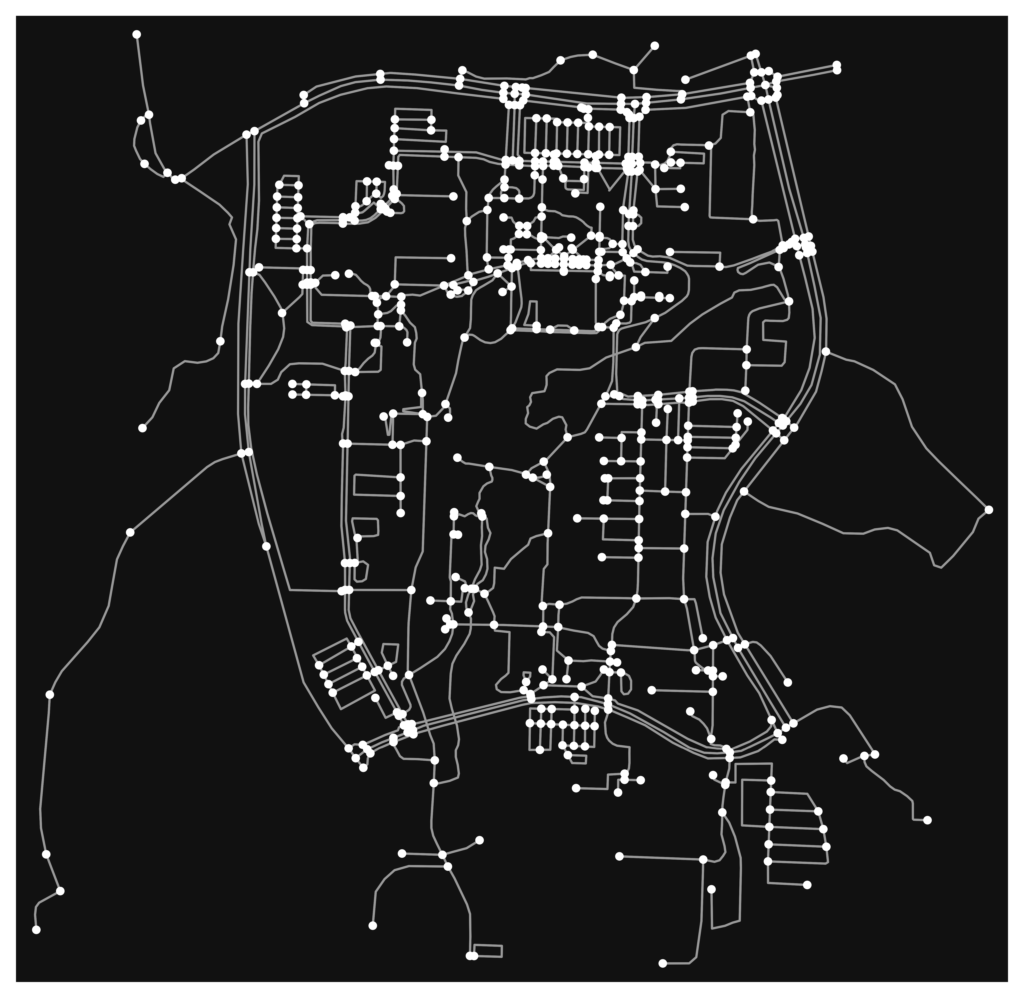

OSMから得られた地理情報を解析して、ノードとエッジに分解した後プロットするスクリプトです。
import osmnx as ox
import matplotlib.pyplot as plt

class Coords:
    def __init__(self,coords: list[float],rad: int) -> None:
        self.lat = coords[0]
        self.lon = coords[1]
        self.rad = rad

coords_1 = Coords(coords = [34.4001625,132.7128455],rad = 700)

G = ox.graph_from_point((coords_1.lat, coords_1.lon), dist=coords_1.rad, network_type='all')

nodes, edges = ox.graph_to_gdfs(G)

# ノードとエッジの情報を表示
print(nodes.head())
print(edges.head())

fig, ax = ox.plot_graph(ox.project_graph(G), show=False)

plt.savefig("a.png", dpi=800, bbox_inches='tight')
>>>
                   y           x          highway  street_count                    geometry
osmid
268182694  34.405498  132.714553  traffic_signals             3  POINT (132.71455 34.40550)
268204301  34.405745  132.710458              NaN             3  POINT (132.71046 34.40574)
268204305  34.404972  132.708325              NaN             4  POINT (132.70833 34.40497)
268204315  34.406273  132.706525  traffic_signals             4  POINT (132.70652 34.40627)
273266001  34.399495  132.708793              NaN             3  POINT (132.70879 34.39950)
                                osmid    name       highway  ...  ref bridge  service
u         v           key                                    ...
268182694 5245596021  0      25128691  イチョウ通り       service  ...  NaN    NaN      NaN
          11096960476 0    1108867749  ブールバール      tertiary  ...  NaN    NaN      NaN
          11096960475 0    1108867749  ブールバール      tertiary  ...  NaN    NaN      NaN
268204301 4280235853  0     428908831     NaN  unclassified  ...  NaN    NaN      NaN
          1307415032  0     115817779  ブールバール      tertiary  ...  NaN    NaN      NaN