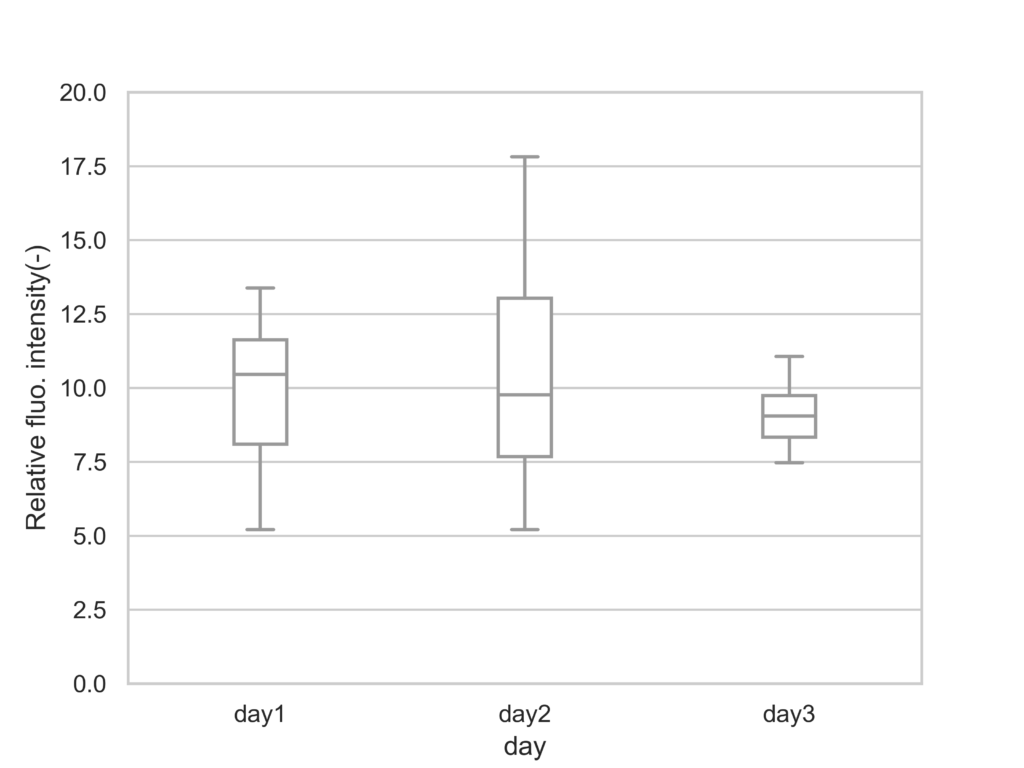

ボックスプロット(箱髭図)を描画するスクリプトです。
import numpy as np
import pandas as pd
from matplotlib import pyplot as plt
import seaborn as sns

plt.style.use('default')
sns.set()
sns.set_style('whitegrid')
sns.set_palette('Set3')


df = pd.DataFrame({
    'day1': np.random.normal(10, 2, 20),
    'day2': np.random.normal(11, 3, 20),
    'day3': np.random.normal(9, 1, 20),
})


df_melt = pd.melt(df)
print(df_melt.head())

fig = plt.figure()
ax = fig.add_subplot(1, 1, 1)
#widthでボックスの幅を変更
sns.boxplot(x='variable', y='value', data=df_melt, showfliers=False, ax=ax, color='white', width=0.2)
ax.set_xlabel('day')
ax.set_ylabel('Relative fluo. intensity(-)')
ax.set_ylim(0, 20)

fig.savefig("box_plot.png",dpi = 500)
実行結果